Exposing metrics from logs using vector.dev
I’ve spent some time recently creating Apache Flink jobs to process data from a number of Kafka topics. The jobs work out some customer related counts so that recurring work could be taken away from some relational databases.
To verfiy the results produced by the Flink jobs were OK, I was able to query the source database and the destination Redis instance that Flink sends its results to. As things scale up though it isn’t practial for me to query the database and redis for every customer thats processed.
There is a feature of Vector.dev I read about in the past and wanted to try out, the ability to convert logs to metrics that Prometheus could scrape. I wasn’t sure how this would work but I took some time to try it out. Im glad I spent the time on it, it gives me a clear visual in a Grafana dashboard showing me the results are progressing or are fully ok.
I wrote a bash script that could query the source database and destination redis periodically for a number of customers and write a brief log line each time. Ideally the source and destination count would be the same resulting in a differecnce of 0 and a “Pass”. If the counts were different it would log the difference and label it as a “Fail”.
The Pass and Fail are mainly there for me to see at a glance, they are not needed for the process to work. The logs look something like the following:
datetime, customerID, source count, destination count, difference, pass/fail
2023-12-18 09:33:22, 12345, 1000, 1000, 0, PASS
2023-12-18 10:33:12, 67890, 500, 200, 300, FAIL
The bash script runs every so often and appends results to the log file each time.
This is where Vector.dev comes in. Vector contains a config file that defines a source, a transformation and a destination. In my case I had a log file as a source and Prometheus metrics as a destination. Vector Remap Language (VRL) is used to define the transformation to apply to the log lines.
The full config file for Vector looks like this:
# A source section pointing to my results log file
[sources.my_source]
  type = "file"
  include = ["/path/to/results.csv"]

# A transformation written using VRL to parse the log lines
[transforms.parse_logs]
  type = "remap"
  inputs = ["my_source"]
  source = '''
  parsed = parse_csv!(.message)
  .log_timestamp = parsed[0]
  .customer = parsed[1]
  .source_count = parsed[2]
  .destination_count = parsed[3]
  .difference = to_int!(parsed[4])
  '''

# structure the output
[transforms.to_metrics]
  type = "log_to_metric"
  inputs = ["parse_logs"]
  metrics = [
    { type = "gauge", field = "difference", tags = { "customer" = "" }, name = "log_difference" }
  ]

# A sink to expose the transformed data for Prometheus
[sinks.prometheus]
  type = "prometheus_exporter"
  inputs = ["to_metrics"]
  address = "0.0.0.0:9598" # Prometheus scrape URL
When Vector starts up, it exposes an endpoint at http://localhost:9598 that Prometheus can scrape.
The output produced by vector looks something like the following, with a lable for each customer, the resulting difference and a timestamp.
log_difference{customer="12345"} 0 1703793649000
log_difference{customer="67890"} 300 1703793649000
A quick update to Prometheus to make it aware of the new endpoint using the port 9598:
scrape_configs:

  - job_name: 'custom_metrics'
    static_configs:
    - targets: ['xxx.xxx.xxx.xxx:9598']
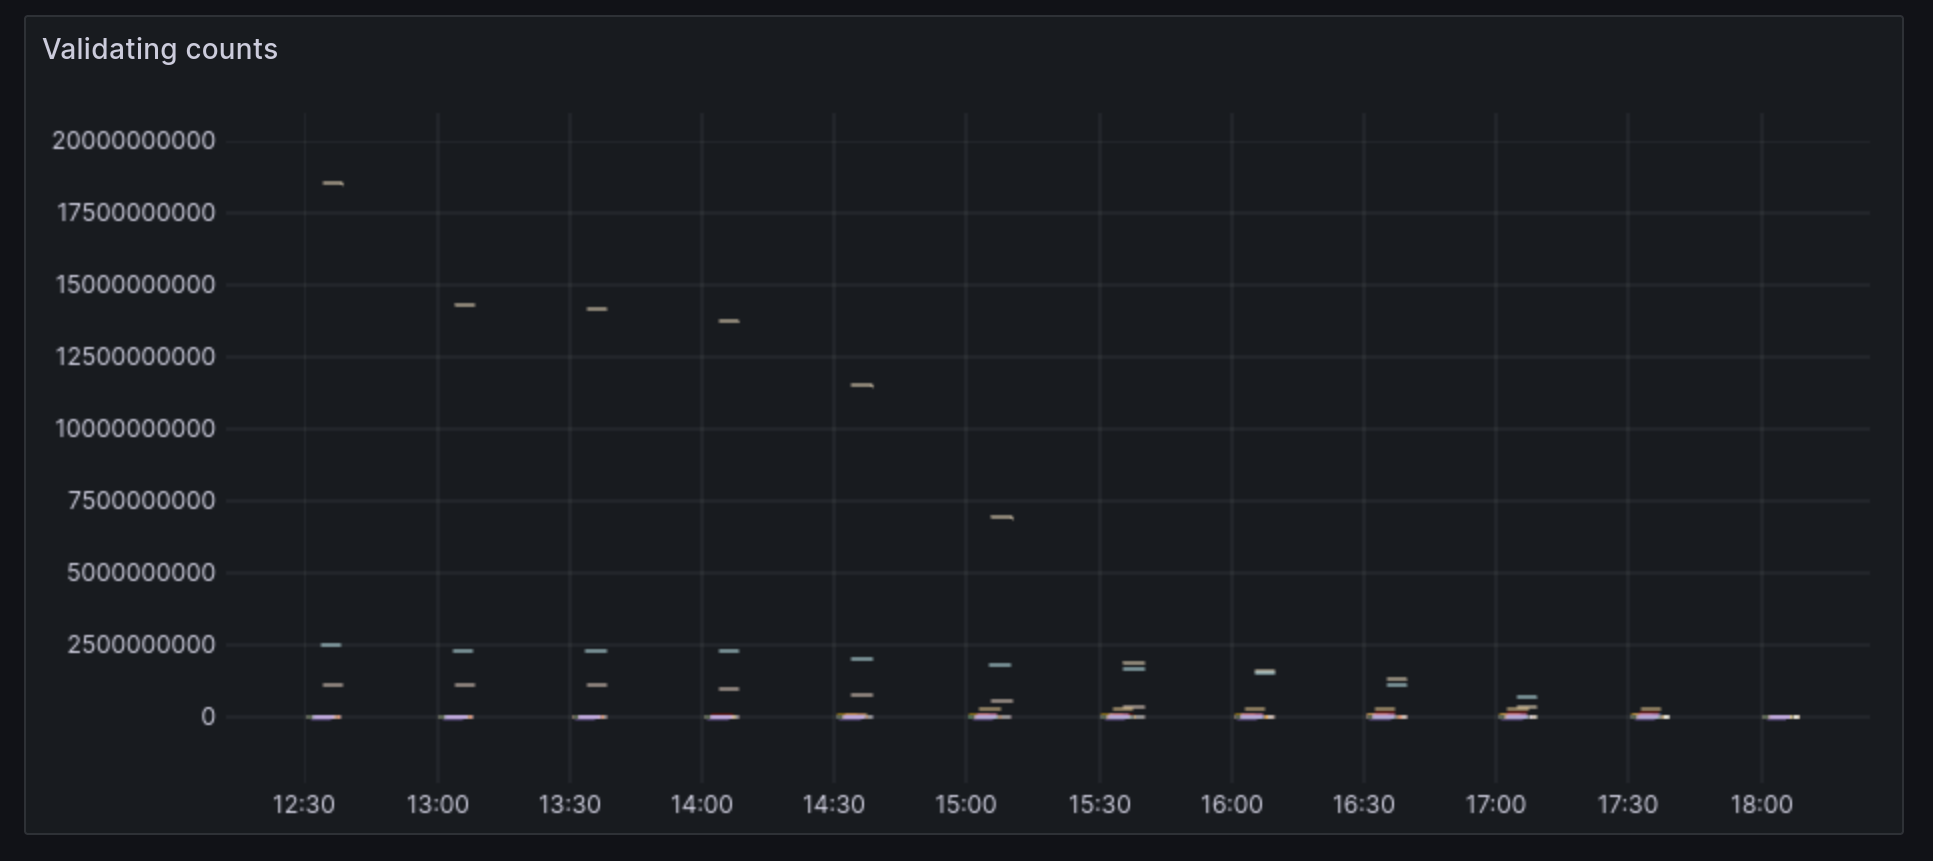
I was then able to create a new Visualization in a Grafana dashboard alonside other Flink info. The following image shows the data is way off in the beginning and becomes consistent ( source and destination = 0 ) as the Flink job completes processing the data.

Having this visualization has been a great addition. I can see the numbers go out of sync at times when Flink is processing large amounts of new data coming in from Kafka and then it syncs up again.