WarpStream Apache Flink and Iceberg for a cost effective scalable logging solution
When developing and debugging systems, having logs is critical. A number of services exist to capture logs and provide a UI for searching and alerting, both 3rd party and self hosted.
However if you have a large volume of logs or if you hope to retain the logs for a long time, the costs can add up quickly.
Using a combination of Vector.dev (a logging agent), Warpstream (a kafka compatible data streaming platform) and Apache Flink (a distributed processing engine) can provide a hugely cost effective and powerful logging solution worth looking at.
- vector.dev is a logging agent that can submit logs to a Kafka cluster. FluentBit can also send logs to Kafka, I tried it out recently here https://github.com/gordonmurray/warpstream_fluent_bit
- Warpstream is a kafka compatible platform that stores data in s3 instead of costly kafka nodes. Saving on maintenance and costs around managing a kafka cluster. Flink can happliy read from WarpStream, I tried it out recently here https://github.com/gordonmurray/apache_flink_and_warpstream
- Flink is a processing engine that can read the data in real time. It can provide insights such as pattern recoginition using its Complex Event Processing (CEP) library as well as stream the data to s3 for long term storage. The data in s3 can use a table format such as Apache Iceberg for long term and structured data. I tried out using Flink to store data in Iceberg format earlier here https://gordonmurray.com/data/2023/11/09/apache-flink-and-apache-iceberg.html
Using some generated access log data we can create a working example of these tools working together to try it out.
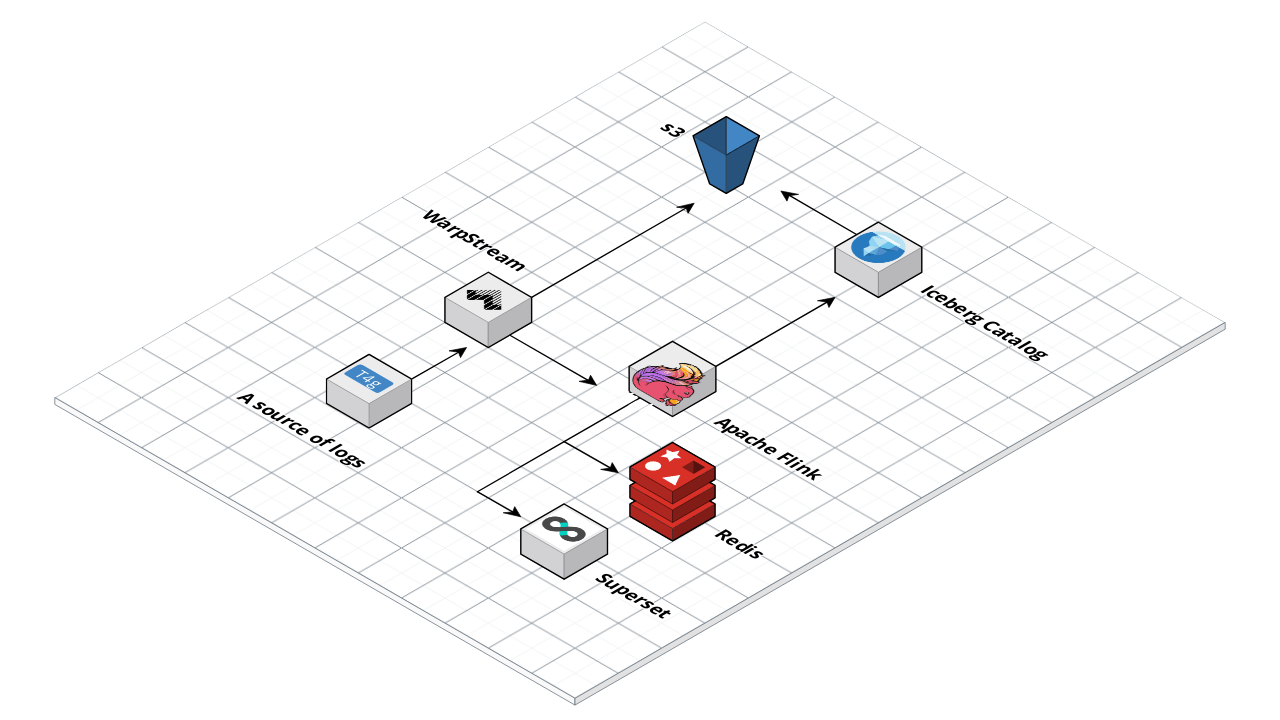
The following diagram shows the end result. Logs coming from a source to WarpStream. WarpStream stores data to s3. Flink reads the data from WarpStream and allows you to run queries on the data and snd the data back to s3 in a format suitable for long time storage and querying.
Installing and running Warpstream
First, create a Warpstream account at https://warpstream.com and create your first virtual cluster. Take note of the cluster ID and create an API key
Install the Warpstream agent using the steps here https://docs.warpstream.com/warpstream/install-the-warpstream-agent
Once installed use the following command to start the virtual cluster:
warpstream agent -agentPoolName apn_[YOUR CLUSTER] -bucketURL s3://[YOUR S3 BUCKET] -apiKey aks_[YOUR API KEY] -defaultVirtualClusterID vci_[YOUR CLUSTER ID] -httpPort 8090
Installing and running Vector.dev
Vector.dev is quick to install and use. There is a handy quick start guide on their site https://vector.dev/docs/setup/quickstart/
Next, add a config file to tell vector to generate some sample logs for us to use, and send those logs to WarpStream
#/etc/vector/vector.toml

data_dir = "/var/lib/vector"

[api]
enabled = true

[sinks.my_sink_id.encoding]
  codec = "json"

[sources.my_source_id]
type = "demo_logs"
count = 1000000
format = "json"
interval = 1
lines = [ "line1" ]

[transforms.parse_apache_logs]
type = "remap"
inputs = ["my_source_id"]
source = '''
  parsed_json = parse_json!(.message)
  .host = parsed_json.host
  .user_identifier = parsed_json."user-identifier"
  .datetime = parsed_json.datetime
  .method = parsed_json.method
  .request = parsed_json.request
  .protocol = parsed_json.protocol
  .status = parsed_json.status
  .bytes = parsed_json.bytes
  .referer = parsed_json.referer
'''

[sinks.my_sink_id]
type = "kafka"
inputs = [ "my_source_id" ]
bootstrap_servers = "localhost:9092"
topic = "logs"
This config consists of a source which generates sample data and a sink which is our warpstream virtual cluster.
The transform block is extracting the fields we need like host, identifier, date and so on from a nested message json.
The bootstrap_servers variable points to localhost:9092 which is the endpoint of your WarpStream agent running locally.
You can start vector with your config file using:
vector -c /etc/vector/vector.toml
With vector and warpstream running, you should be receiving some data in to your s3 bucket.
If you have the AWS CLI installed, you could view the content of your s3 bucket using the following command to see if there is any new data in your bucket
aws s3 ls s3://my-test-bucket/
Or if you have the kafka cli, you could list the topics and get some messages
# list topics in the cluster
./bin/kafka-topics.sh --bootstrap-server localhost:9092 --list

# list messages in a topic called logs
./bin/kafka-console-consumer.sh --topic logs --from-beginning --bootstrap-server localost:9092
Flink job to read from the logs topic
You can start a Flink cluster using Docker compose from this repo https://github.com/gordonmurray/apache_flink_and_warpstream_for_logs
Now we can get to the fun part of querying the log data using Flink. First we can create a table to hold the logs and perform some quick queries
Connect to the Flink SQL console using:
./bin/sql-client.sh
And create a table to hold the logs. Make sure to add your Magic URL to the bootstrap.servers field.
CREATE TABLE apache_logs (
  `bytes` INT,
  `datetime` STRING,
  `host` STRING,
  `message` STRING,
  `method` STRING,
  `protocol` STRING,
  `referer` STRING,
  `request` STRING,
  `service` STRING,
  `source_type` STRING,
  `status` STRING,
  `mytimestamp` TIMESTAMP(3) METADATA FROM 'timestamp',  -- assuming timestamp is in standard format
  `user_identifier` STRING,
    WATERMARK FOR mytimestamp AS mytimestamp - INTERVAL '5' SECONDS
) WITH (
    'connector' = 'kafka',
    'topic' = 'logs',
    'properties.bootstrap.servers' = 'api-xxxxxxxxxxxxxxxxxx.warpstream.com:9092',
    'properties.group.id' = 'flink',
    'scan.startup.mode' = 'earliest-offset',
    'format' = 'json',
    'json.fail-on-missing-field' = 'false',
    'json.ignore-parse-errors' = 'true'
);
Once the table is created you can query it like a regular table in a relational database
select * from apache_logs;
Pattern Recognition using FLink
We can use Flink to keep an eye on our logs for some key patterns such as
- repeated access from the same IP address with varying user agents within a short time frame, suggesting a script or bot trying to access your system.
- Identify sequences of increasing error rates (e.g., 4xx or 5xx HTTP status codes)
- frequent calls to specific endpoints, to optimize backend performance or improve API design.
An example query in flink to spot the same ip address with varying user agents as an example:
SELECT
    host AS ip,
    COUNT(DISTINCT user_identifier) AS user_identifier_count,
    TUMBLE_START(mytimestamp, INTERVAL '1' MINUTE) as window_start,
    TUMBLE_END(mytimestamp, INTERVAL '1' MINUTE) as window_end
FROM apache_logs
GROUP BY
    host,
    TUMBLE(mytimestamp, INTERVAL '1' MINUTE)
HAVING
    COUNT(DISTINCT user_identifier) > 2;
heres some sample output from a query like this if it found some results that needed attention
| ip          | user_identifier_count | window_start        | window_end          |
|-------------|-----------------------|---------------------|---------------------|
| 192.168.1.1 | 3                     | 2023-11-18 10:00:00 | 2023-11-18 10:01:00 |
| 172.16.0.2  | 4                     | 2023-11-18 10:01:00 | 2023-11-18 10:02:00 |
| 10.0.0.3    | 5                     | 2023-11-18 10:02:00 | 2023-11-18 10:03:00 |
| 192.168.1.1 | 3                     | 2023-11-18 10:03:00 | 2023-11-18 10:04:00 |
| 10.0.0.3    | 6                     | 2023-11-18 10:04:00 | 2023-11-18 10:05:00 |
In this table:
ipis the IP address of the host.user_identifier_countis the count of distinct user identifiers accessing the host in that time window.window_startandwindow_enddefine the one-minute interval over which this aggregation is calculated.
This output suggests that between 10:00 and 10:01, the host at IP 192.168.1.1 was accessed by 3 distinct user identifiers. The fact that these counts are greater than 2 (as per the HAVING clause) indicates a relatively high level of activity or possibly different user agents interacting with the same host within that minute, which might be an interesting pattern to investigate further. Or it could just be members of a family accessing a popular web site.
While its great to query the logs here, the table disappears once you close the Flink console.
By default, Kafka or in this case WarpStream won’t store the log data long term either by design. You can set up infinite retention in Kafka, though that will add up in disk space cost when using kafka nodes.
Apache Iceberg for long term and low cost storage
Flink can help out here too. It can read the data from the logs topic and save it to s3 using a table format from Apache Iceberg. Apache Iceberg is “is a high-performance format for huge analytic tables. Iceberg brings the reliability and simplicity of SQL tables to big data”.
WarpStream will hold the newest logs as they come in and Flink can copy that data to s3 in a format that is efficient and available to query at any time for any historic queries you might like to run.
In Flink you can create a new Catalog which facilitates the storage to s3 for you.
Then you can create a table in the catalog and send data to it.
Heres the full Job for flink to read the data and send it to s3
USE CATALOG default_catalog;

CREATE CATALOG iceberg_catalog WITH (
    'type' = 'iceberg',
    'catalog-type' = 'hadoop',
    'warehouse' = 's3a://my-test-bucket-gordon/iceberg',
    's3a.access-key' = 'xxxxx',
    's3a.secret-key' = 'xxxxx',
    'property-version' = '1'
);

USE CATALOG iceberg_catalog;

CREATE DATABASE IF NOT EXISTS logs_database;

USE logs_database;

create temporary table apache_logs (
  `bytes` INT,
  `datetime` STRING,
  `host` STRING,
  `message` STRING,
  `method` STRING,
  `protocol` STRING,
  `referer` STRING,
  `request` STRING,
  `service` STRING,
  `source_type` STRING,
  `status` STRING,
  `mytimestamp` TIMESTAMP(3) METADATA FROM 'timestamp',  -- assuming timestamp is in standard format
  `user_identifier` STRING,
    WATERMARK FOR mytimestamp AS mytimestamp - INTERVAL '5' SECONDS
) WITH (
    'connector' = 'kafka',
    'topic' = 'logs',
    'properties.bootstrap.servers' = 'api-xxxxxxxxxxxxxxxxxx.warpstream.com:9092',
    'properties.group.id' = 'flink',
    'scan.startup.mode' = 'earliest-offset',
    'format' = 'json',
    'json.fail-on-missing-field' = 'false',
    'json.ignore-parse-errors' = 'true'
);

CREATE TABLE IF NOT EXISTS apache_logs_archive (
    `bytes` INT,
    `datetime` STRING,
    `host` STRING,
    `message` STRING,
    `method` STRING,
    `protocol` STRING,
    `referer` STRING,
    `request` STRING,
    `service` STRING,
    `source_type` STRING,
    `status` STRING,
    `mytimestamp` TIMESTAMP(3) METADATA FROM 'timestamp',  -- assuming timestamp is in standard format
    `user_identifier` STRING,
) WITH (
    'format-version'='1'
);

SET 'execution.checkpointing.interval' = '60 s';

INSERT INTO apache_logs_archive (bytes, datetime, host, method, protocol,referrer, request, service) SELECT bytes, datetime, host, method, protocol,referrer, request, service FROM apache_logs;
You now have some (sample) data logging to WarpStream and s3. Flink is then pulling in the data and storing it for long term storage in Iceberg format on s3 with Flink ready to work on your data to spot patterns such as errors or malicious use and send it wherever you need.
Visualizing logs with Apache Superset
Apache Superset can add the final step, a “data exploration and data visualization able to handle data at petabyte scale.”
Using Flinks SQL Gateway and JDBC connector, Superset can read from Flink but thats a post for another day!
The code snippets used here are available on Github at https://github.com/gordonmurray/apache_flink_and_warpstream_for_logs