Monitoring Apache Flink containers using Prometheus
Apache Flink comes with a Prometheus plugin already in place in the /plugins folder and ready to use without adding any additional JAR files.
While running Flink in containers, we’ll need to use cAdvisor to gather the metrics from the containers so that Prometheus can scrape them.
One quick note; if you are running docker compose on an AWS EC2 instance, the cAdvisor container won’t work on ARM based instances like the t4g or r6gs as it doesn’t have a build for ARM based instances that I have found.
We can add cAdvisor to the docker compose file using the following block. It will run a container called cadvisor that will collect the metrics from the running flink containers. When its running, cAdvisor has a UI at htp://localhost:8080 and the metrics can be scraped from http://localhost:8080/metrics
Add the following to your docker-compose.yml file:
  cadvisor:
    image: gcr.io/cadvisor/cadvisor
    container_name: cadvisor
    ports:
      - "8080:8080"
    volumes:
      - /:/rootfs:ro
      - /var/run:/var/run:rw
      - /sys:/sys:ro
      - /var/lib/docker/:/var/lib/docker:ro
In our Flink containers, we need to add some environment variables to enable the prometheus metrics:
metrics.reporters: prom
metrics.reporter.prom.factory.class: org.apache.flink.metrics.prometheus.PrometheusReporterFactory
metrics.reporter.prom.port: 9091
To run the containers use the following command. If you are running docker compose for the first time, it may take a minute to download the images and run them.
docker compose up -d
Once the containers are up and running you can see a list of them using:
docker ps
To confirm that each container is exposing its prometheus metrics, you can connect to each container and curl localhost:9091 as follows
# first connect to a task manager
 docker exec -it apache_flink_and_docker_compose-taskmanager-1 /bin/bash

# then curl the metrics
root@1aa3fb3bd007:/opt/flink# curl localhost:9091
you should see a longish output similar to the following:
# HELP flink_taskmanager_Status_JVM_Memory_NonHeap_Used Used (scope: taskmanager_Status_JVM_Memory_NonHeap)
# TYPE flink_taskmanager_Status_JVM_Memory_NonHeap_Used gauge
flink_taskmanager_Status_JVM_Memory_NonHeap_Used{host="172_18_0_7",tm_id="172_18_0_7:38235_53686e",} 5.5132808E7
# HELP flink_taskmanager_Status_JVM_CPU_Load Load (scope: taskmanager_Status_JVM_CPU)
# TYPE flink_taskmanager_Status_JVM_CPU_Load gauge
flink_taskmanager_Status_JVM_CPU_Load{host="172_18_0_7",tm_id="172_18_0_7:38235_53686e",} 0.0
# HELP flink_taskmanager_Status_JVM_GarbageCollector_G1_Old_Generation_Time Time (scope: taskmanager_Status_JVM_GarbageCollector_G1_Old_Generation)
# TYPE flink_taskmanager_Status_JVM_GarbageCollector_G1_Old_Generation_Time gauge
Assuming you have prometheus running on another server, you won’t be able to get Prometheus to connect to each container running on a remote server. This is where cAdvisor comes in. It can get the metrics from each container and expose them so that Prometheus can scrape them remotely.
Assuming your cAdvisor container is running, you can curl localhost on port 8080/metrics to see the combined metrics from the running containers:
curl localhost:8080/metrics
You should see a similar but longer version of the list of metrics from when you curled the metrics from inside a container.
A guide on how to set up Prometheus would need a blog post in itself. However if you have Prometheus already running, in your Prometheus config file, you’ll need to add a job to let prometheus know about our flink instances so it can poll the metrics to power a grafana dashboard or any alerts. You’ll need to add a block like this one, pointing to the IP address of your flink server:
  - job_name: 'flink_instance'
    static_configs:
      - targets: ['100.xxx.xxx.xxx:8080']
Or, if you are using service discovery in Prometheus you can use the following job to look for ec2 instances using a particular Tag and value instead:
  - job_name: 'flink-job-managers'
    ec2_sd_configs:
      - region: 'us-east-1'
        profile: 'MY-IAM-PROFILE'
        port: 8080
        filters:
          - name: tag:Name
            values:
              - 'Flink Job Manager'
    relabel_configs:
Some of the metrics Id recommend monitoring to help debug flink jobs are below. You won’t see these metric names show up until you have some jobs running first in Flink.
- flink_taskmanager_job_task_busyTimeMsPerSecond - This will help show how busy the task managers are for any given second. Often this value will spike up if you are starting a new Flink Job and will settle once the job is running smoothly.
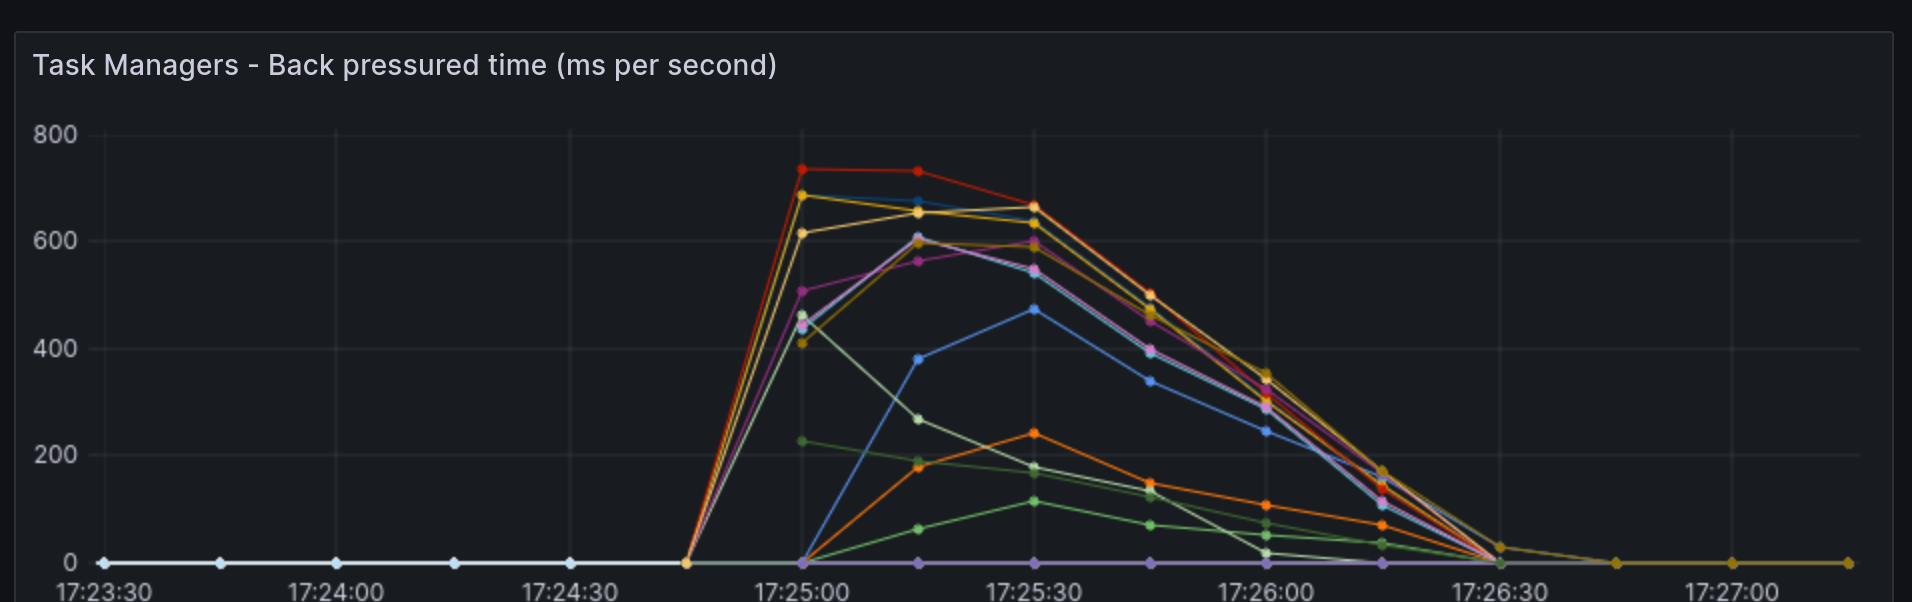
- flink_taskmanager_job_task_backPressuredTimeMsPerSecond - Similar to busy time, this will show how busy your flink jobs are. This should settle too and if it doesn’t you’ll need to look in to the performance of your Flink jobs.
- flink_jobmanager_job_runningTime - This one is useful to watch. It should be a growing value counting up the running time of a job. If it keeps starting over, that means one or more of your jobs have restarted and may need attention
- flink_jobmanager_job_numRestarts - This is a more direct metrics to let you know if your jobs are restarting and how often
- flink_taskmanager_Status_JVM_Memory_Heap_Used - Its useful to keep an eye on the heap memory being used by the flink jobs. If this goes too high, your jobs might be suffering any you might need to give Flink more memory or optimize yur jobs
The following image is a visualisation of the flink_taskmanager_job_task_backPressuredTimeMsPerSecond metric showing a new job thats busy for a few minutes.
The changes mentioned here to enable the metrics have been added to a docker compose file here in an earlier project that shows how to perform some basic CDC from ariadb to Redis using Flink:
https://github.com/gordonmurray/apache_flink_and_docker_compose